
Most social media reports are full of numbers that feel meaningful and move nothing.
Impressions, reach, follower growth, profile visits – they all make a monthly deck look busy. But if you can’t connect any of them to revenue or pipeline, you’re not doing reporting, you’re doing performance theatre.
The metrics that actually matter depend entirely on what you’re trying to do. That sounds obvious, and it is. What’s less obvious is that most businesses don’t ask that question before they start measuring, which is why they end up optimising for vanity stats that bear no relationship to the outcomes they actually care about.
Here’s how to read what your analytics are actually telling you.
Start with the question your boss is going to ask
Before you open a single dashboard, ask: What does a good month on social media look like for this business?
If the answer is “more followers”, you have a problem that no amount of data will fix. Followers are an output of doing the right things, not a goal in themselves. A business that gained 50 followers last month and generated three qualified leads had a better month than a business that gained 500 followers and generated none.
The question underneath the question is: What action do you want someone to take after seeing your content? If you can’t answer that, your metrics will always feel arbitrary – because they are.
Once you’re clear on the action, you can work backwards to the metrics that tell you whether it’s happening.
Reach and impressions are not the same thing
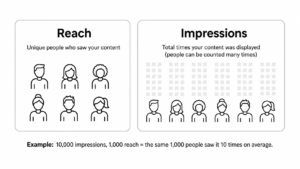
Reach is the number of unique people who saw your content. Impressions are the total number of times it was displayed, including multiple views by the same person.
Both numbers can be misleading in isolation.
High impressions with low reach means the same people are seeing your content repeatedly. That’s not necessarily bad – it can indicate strong algorithm favourability or a loyal audience – but it tells you nothing about whether you’re getting in front of new people.
High reach with low engagement means your content is appearing in feeds but not stopping anyone. That’s the more useful signal. If thousands of unique people saw a post and only two of them liked it, the content isn’t connecting. That’s a content problem, not a distribution problem.
Generally, the ratio to watch is engagement rate – how many people who saw your content actually did something with it. There isn’t one “official” engagement rate formula: different platforms and reports use different denominators (for example, reach, impressions, or followers), so the important thing is to be clear on which one you’re using and to stick with it. Benchmarks vary widely by platform and industry, so what matters most is the trend: if your engagement rate is declining month on month, something has changed – in your content, your audience composition, or the platform’s algorithm.
What engagement actually means depends on the type
Not all engagement is equal.
A like is passive. It costs one tap and requires no particular conviction about your content. High likes with low comments or shares usually indicates agreeable content – content that people feel fine about, but don’t feel compelled to act on.
A comment is active. Someone stopped scrolling to type something. That’s what we call an engagement signal. Even negative comments – disagreement, pushback, pedantic corrections – are more valuable than a wall of likes, because they tell you the content created a reaction strong enough to overcome the friction of typing.
A share is often a high-value engagement signal on many platforms. When someone shares your content, they’re putting their own credibility behind it. That’s trust. Shares extend organic reach without additional budget, and they’re the hardest engagement type to manufacture.
If you’re optimising for brand awareness, pay more attention to the posts people are willing to share or save for later – that’s the stuff they think is worth putting their name to. If you’re trying to build an actual community, comments matter more than anything else, because someone cared enough to stop scrolling and say something. If your goal is traffic, look at link clicks and whatever your platform calls its link sticker tap‑through rate (e.g. the % of Story viewers who tap a link sticker), not just vague “reach”. Likes, on their own, tell you almost nothing about whether any of this is actually working.
The link between social and site traffic is harder to trace than people think
Attribution on social media is genuinely messy.
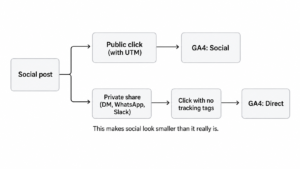
In many cases, analytics platforms (including GA4) will show you direct traffic as a significant chunk of your sessions. A meaningful proportion of that direct traffic is often dark social – people who clicked a link from a private message, WhatsApp group, or Slack channel. That traffic usually doesn’t carry UTM (tracking) parameters – the little tags you add to URLs so tools like GA4 know which campaign or channel a click came from – and it doesn’t show up under Social in your reports. What this means is that if you’re judging the impact of your social media by looking at sessions attributed to “Social” in GA4, you’re likely undervaluing it.
A better approach: use UTM parameters on every link you post publicly, and look at branded search volume as a downstream proxy. If your social content is building awareness and familiarity, branded search tends to rise – people who see you repeatedly on Instagram or LinkedIn will eventually search for you directly. If your branded search in Google Search Console is flat despite active social posting, that’s useful information.
The most honest number is conversions – not clicks, not sessions. How many people who came from social media did the thing you wanted them to do? If your social content converts at a significantly lower rate than organic search, that doesn’t necessarily mean social isn’t working. It might mean you’re attracting different intent – awareness stage versus consideration stage – and your conversion path needs to account for that.
Platform-specific things worth knowing
Reach and impressions on Instagram have historically been inflated by the algorithm’s habit of showing content to followers multiple times. Saves are one of the strongest engagement signals on this platform – a save indicates the person found the content useful enough to return to. Save rate (saves divided by reach) is underused as a metric and more predictive of content quality than likes.
Impressions on LinkedIn are counted differently from most platforms – for now, a post registers an impression when it’s 50% visible in a user’s feed for at least 300 milliseconds. What this means in practice: impression counts can be inflated by low-quality exposure. The comment-to-like ratio is more informative here than the raw like count. Posts that attract senior practitioners in genuine debate are doing more for your brand than posts that get 200 likes from people who are first-degree connections being polite.
Organic reach on Facebook has declined significantly over the past decade and continues to do so. According to Hootsuite’s Social Media Trends report, Facebook organic now functions primarily as a retargeting surface and a community tool for many businesses, rather than a top‑of‑funnel awareness channel. If you’re reporting on Facebook organic reach and trying to draw conclusions about content performance, make sure you’re comparing like for like, since post type, boosting status, and audience composition all affect the numbers significantly.
What to do when the numbers don’t add up
Sometimes your analytics tell you something is working when it clearly isn’t, or vice versa. That’s usually a tracking problem, not a content problem.
The three most common reasons your social data is unreliable:
- UTM parameters aren’t being applied consistently. If some posts are tagged and others aren’t, your attribution data is incomplete and any conclusions you draw from it will be skewed.
- You’re looking at the wrong time window. Social media often drives delayed conversions – someone sees a post, thinks about it for a week, then searches for you and converts through organic. If you’re attributing conversions to the source of the last click only, you’re missing the social assist entirely.
- You’re comparing metrics across platforms without adjusting for how each platform defines them. An impression on TikTok is not the same as an impression on LinkedIn. A “view” on an Instagram Story is counted differently from a YouTube view (for example, some platforms count a Story view after only a brief glance, while others require longer watch time), and aggregating these into a single “total impressions” figure tells you almost nothing. Aggregating these into a single “total impressions” figure tells you almost nothing.
Before you trust a number, ask how it was collected and what it represents. Most social platforms have a vested interest in making their metrics look good. That doesn’t make the data useless, but it does mean you should know what you’re actually looking at.
The reporting framework that actually helps
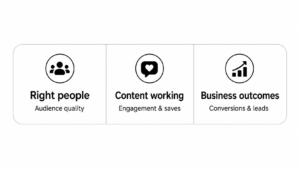
A useful social media report answers three questions:
- Are we reaching the right people? (Audience quality check: follower demographics, comment quality, who’s engaging)
- Is the content working? (Engagement rate trend, saves, shares, comment sentiment)
- Is social contributing to business outcomes? (Attributed conversions, branded search trend, leads from social)
If your current report doesn’t answer those three questions, it doesn’t matter how many metrics are in it.
The number your boss should care about is the one that connects social to something that affects revenue. Everything else is context for explaining why that number moved.
A note on benchmarks
Industry benchmarks for social media metrics are wide enough to be often misleading in most cases. An average engagement rate for a B2B SaaS company on LinkedIn is not a useful comparison point for a coaching business on Instagram.
What’s more useful is your own historical trend. Is your engagement rate this month higher or lower than last month? Is your save rate improving? Are you getting more comments per post, or fewer?
Benchmark against yourself before benchmarking against an industry average. You have more data about your own audience than any study does, and your trends will tell you more than any external comparison.
Social media analytics are only useful if they’re connected to a decision. If you look at a number and can’t name a change it would cause you to make, it’s not a reporting metric – it’s noise. Start with the decision, work backwards to the metric that would inform it, and ignore everything else.
FAQs
What social media metrics actually matter for business?
The ones you can connect to an action or outcome. Engagement rate (total engagements divided by reach), shares, saves, link clicks, and conversions are worth tracking because they tell you whether content is doing something. Impressions, follower count, and raw likes are not useless, but they don’t tell you whether the content worked – only that it appeared.
What’s the difference between reach and impressions?
Reach is the number of unique people who saw your content. Impressions is the total number of times it was displayed, including the same person seeing it multiple times. A post with 10,000 impressions and 1,000 reach means the same thousand people saw it 10 times on average. Neither number on its own tells you whether the content landed – engagement rate does.
Why doesn’t my social traffic show up properly in GA4?
Possibly because of dark social – links shared in WhatsApp, Slack, direct messages, and email don’t carry tracking tags, so GA4 can’t identify them as social traffic. They get recorded as direct visits instead, which makes social look less effective than it is. The fix is to add UTM parameters (tracking tags) to every link you post publicly. Branded search volume in Google Search Console – people searching your business name directly – is also a useful downstream indicator that social awareness is building.
How often should I report on social media performance?
Monthly works for most businesses. Weekly is too short a window. Social data fluctuates enough that a single bad week can look like a trend when it isn’t. Monthly reporting gives you enough data to identify what’s actually changing, and it matches the rhythm most stakeholders expect. Paid social is the exception: spend pacing and conversion rates should be checked weekly.
Is engagement rate the same across platforms?
No – each platform calculates it differently, and their algorithms reach different proportions of your audience. An engagement rate of 2% on LinkedIn and 2% on Instagram don’t mean the same thing. Track each platform separately and compare it against its own history rather than against other platforms.
Why is my engagement rate dropping even though my follower count is growing?
Usually because a larger, more varied audience means fewer people find any given post directly relevant to them. It can also signal an algorithm change or a shift in content format that isn’t resonating. Check whether the drop is consistent across all post types or concentrated in one. If it’s isolated to a format, that’s a content problem. If it’s across the board, the audience composition has likely shifted.
- Analytics
- Conversion Rate Optimisation
Nicole Newman
With a decade of experience in digital and brand marketing, Nicole has worked across industries like FMCG, e-commerce, SaaS, and retail, crafting data-driven strategies that resonate with consumers. Her expertise in B2C marketing, consumer behaviour insights, and multi-channel campaigns enables her to drive meaningful brand engagement and business growth. Having worked both agency- and client-side, she thrives in fast-paced environments, leading teams to execute impactful digital campaigns that leave a lasting impression. When she’s not refining digital strategies, Nicole indulges her creative side—painting, crafting quirky home décor, or getting lost in a book by Spike Milligan or other Monty Python-esque humourists.
YOUR RECOMMENDED Blog
More insights to fuel your growth
Dive deeper into strategies that transform businesses
What’s holding your growth back?
In under 5 minutes, you’ll get a custom scorecard on where your digital marketing stands - and what to fix next.